
We offer two ways to help you understand the solution to this query. Pick whichever works best for you:
Prefer to watch? Start with our short walkthrough video that shows you exactly how it works, step by step.
Prefer to read? Scroll down for the full written guide with screenshots and detailed explanations.
Until now, the Portfolio Manager kept US filings and international filings in two separate tabs. Getting a consolidated view of all your applications meant switching between them.
The TIP Tool™ now lets you choose. A new setting in the Admin Panel lets you combine US and international applications into a single Applications tab.
This article covers how to set the consolidated view and what it gives you.
| Note: Only the owner and the Admin can change the combined application view setting in Portfolio Manager. |
How to Set the Combined View of Patent Applications in the Portfolio Manager?
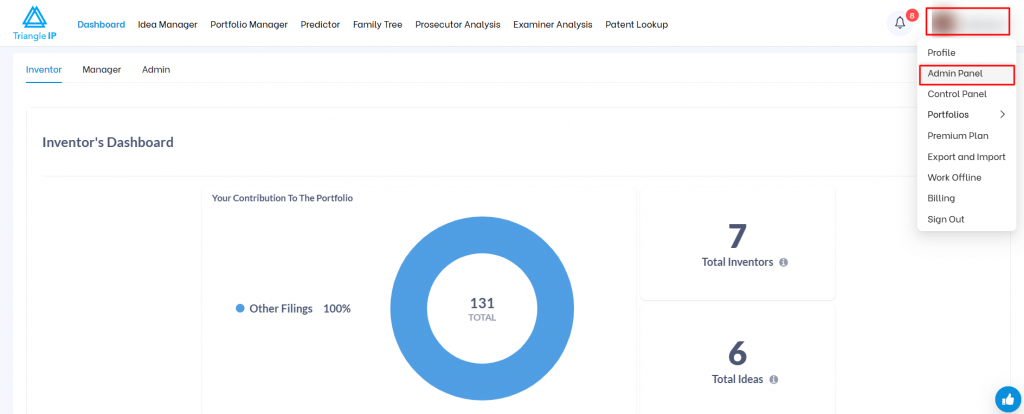
Step 1: Click on your Profile and choose the Admin Panel option.
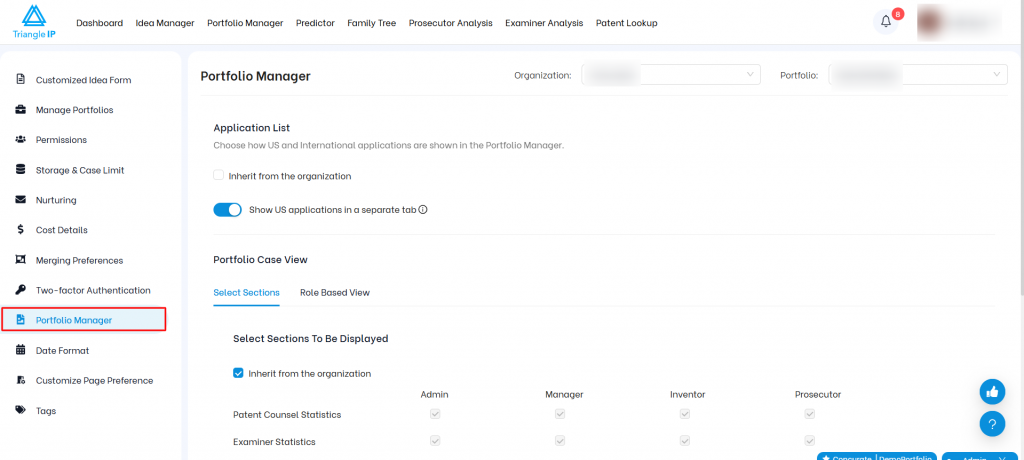
Step 2: From the left-side panel, select the Portfolio Manager option.
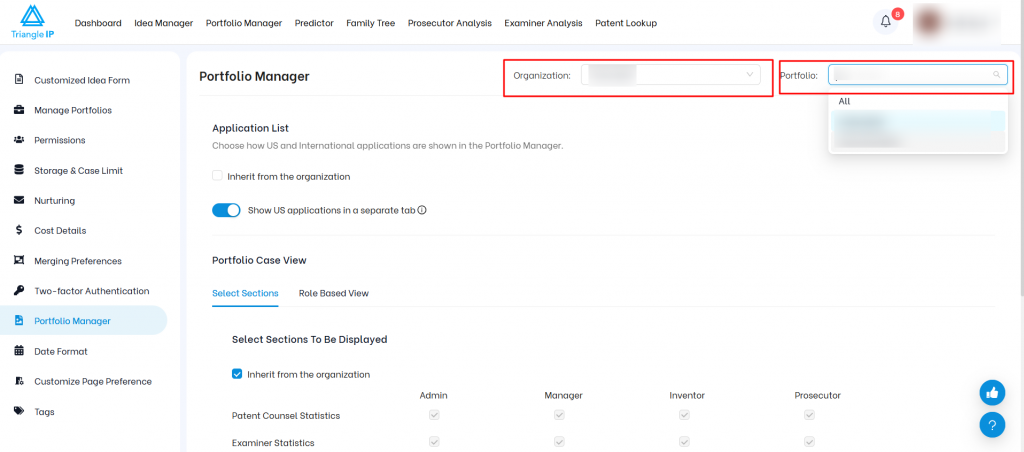
Step 3: Choose the Organization and the Portfolio from the dropdowns at the top right. The combined view applies to whichever portfolio you choose here.
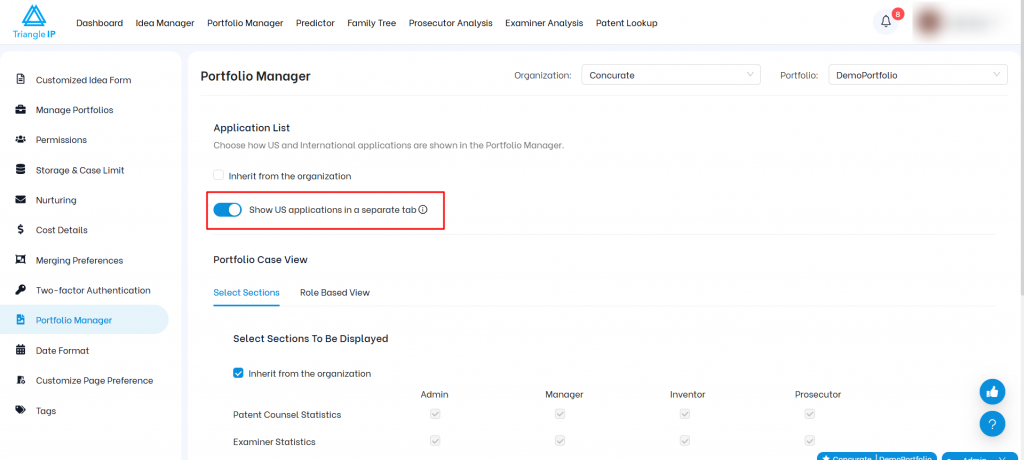
Step 4: Turn off the Show US applications in a separate tab toggle.
Return to the Portfolio Manager to see the combined view.
| Note: To view US applications and international applications under separate tabs, turn on the Show US applications in a separate tab toggle. |
What Changes You’ll See in The Combined View of Portfolio Manager?
Turning the toggle off changes two things at once. US and international filings move into a single list, and the graphs above it now have two panels, Overview and By Country.
Here is what each part looks like.
1. Combined Overview
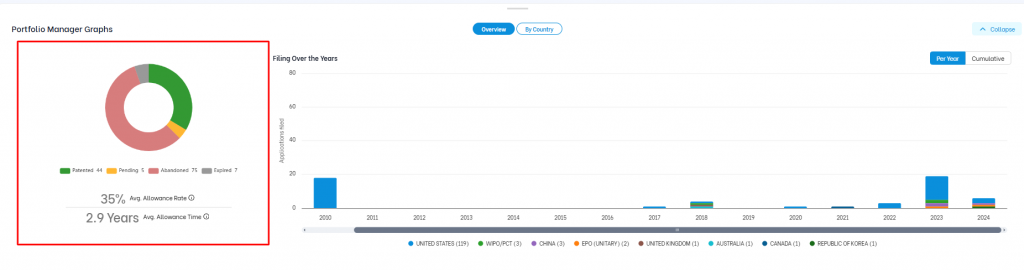
The Overview panel of the carousel holds two charts side by side.
- Status Overview
- Filing trend
Status Overview
The first is a donut chart showing the status of your whole portfolio. It covers Patented, Pending, Abandoned, and Expired.
Filing Trend
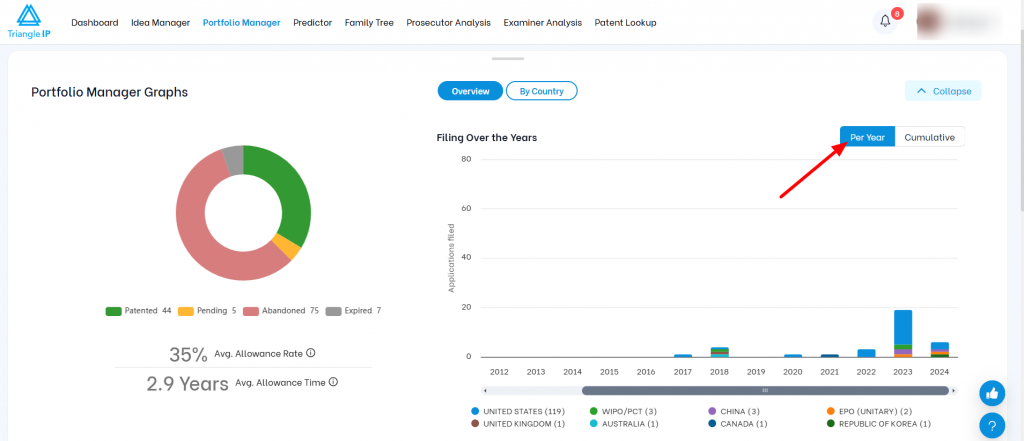
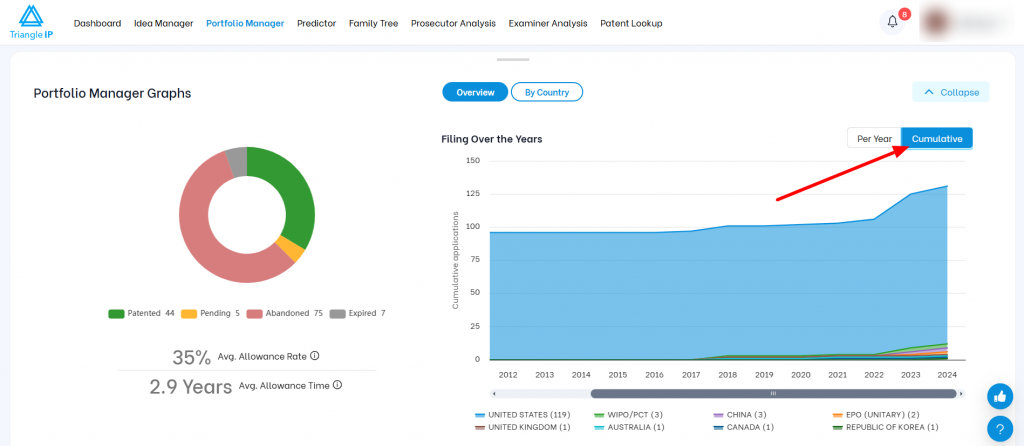
The second chart in the Overview panel is Filing Over the Years. It plots your filing activity across every year in the portfolio, stacked by country.
A switch at the top right gives you two ways to read it:
- Per Year shows what you filed in each year
- Cumulative shows the total number of applications filed up to that year
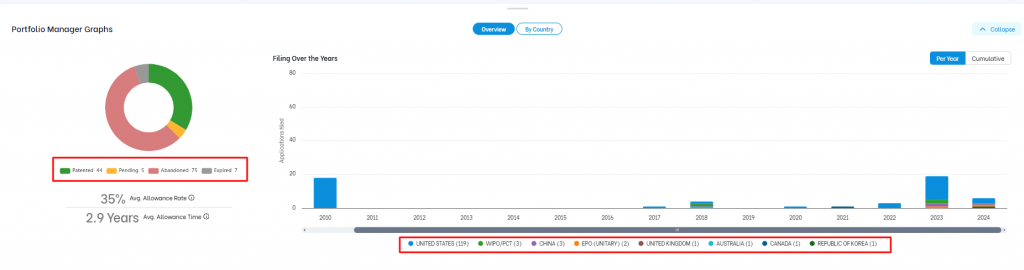
Both charts in the Overview panel have a clickable legend. Clicking an item removes it from the chart, and the figures recalculate for the selected items. Click the same item again to bring it back.
2. By Country: Word Cloud and Bar Graph
The By Country panel shows how many applications you hold in each country, split by status. A switch at the top right lets you view that as a word cloud or a bar graph.
WordCloud
Word Cloud sizes each country name by the number of applications you hold there.
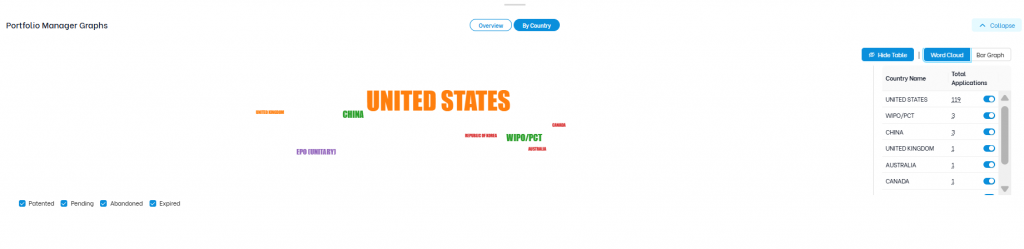
A table sits beside the word cloud, listing all the countries with their total number of applications. This table is visible by default. Click Hide Table to view the word cloud at full width.
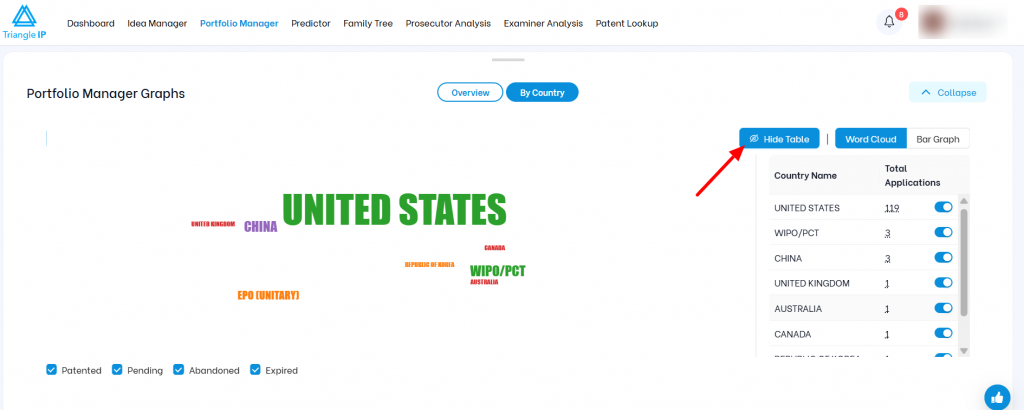
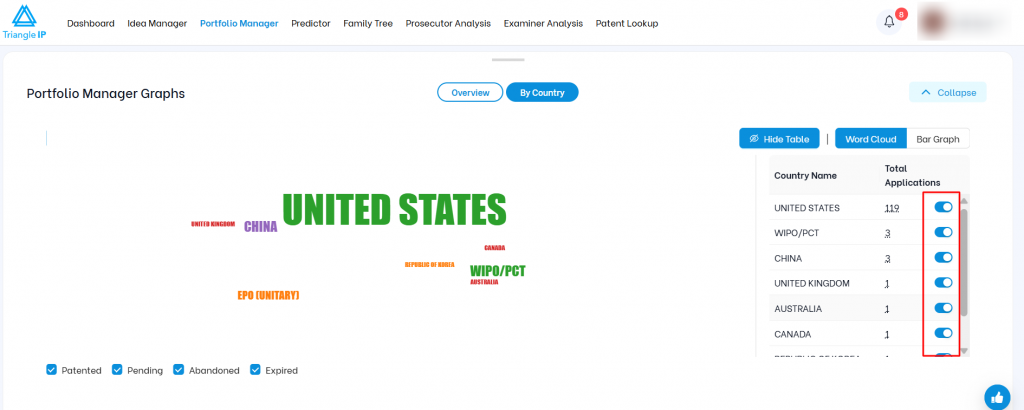
To exclude a country from the word cloud, disable that country’s toggle in the table.
Bar Graph
Bar Graph shows the number of patent applications as stacked columns, running from your largest jurisdiction down to your smallest. Each column is coloured by status, with the country total displayed above it.
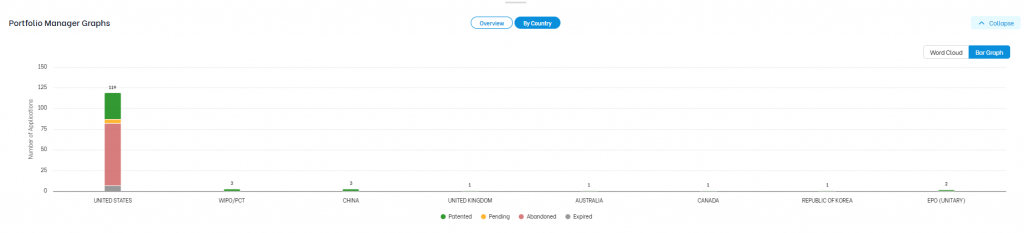
Both views let you narrow the graph by status. The word cloud uses checkboxes below the chart, and the bar graph uses a clickable legend.
3. Applications Tab
Every filing now sits in one Applications tab. The count in the heading covers US and international filings together.
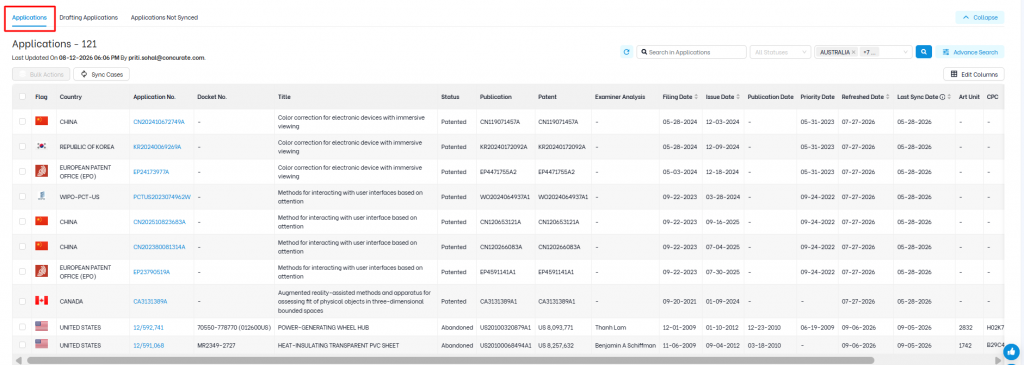
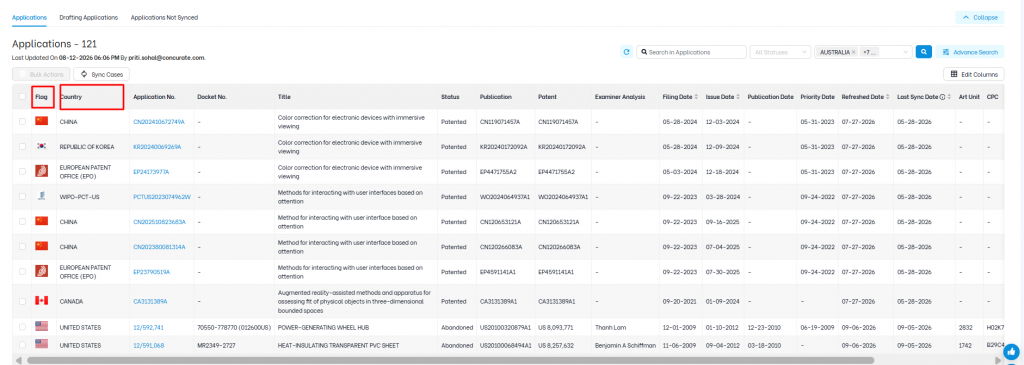
You can use the Flags and the Country column to tell jurisdictions apart quickly.
When To Select The Combined View?
The combined view tends to work best when:
- You want a single count of everything on file.
- You need to compare filing activity across jurisdictions in one place.
In the TIP Tool™, both views stay available, so you can switch back whenever your needs change.