We offer two ways to help you understand the solution to this query — pick whichever works best for you:
Prefer to watch?
Start with our short walkthrough video that shows you exactly how it works, step by step.
Prefer to read?
Scroll down for the full written guide with screenshots and detailed explanations.
Understanding how your patent applications are related is essential to building and maintaining a strong, strategic IP portfolio. That’s why the TIP Tool™ offers a powerful Patent Family Tree Generator helping you visualize how applications connect.
Patent families typically include:
- Continuation applications (re-filing with new claims, no new content)
- Continuation-in-part (CIP) applications (adds new matter to earlier content)
- Divisional applications (splits multiple inventions into separate filings)
- Provisional-to-nonprovisional transitions
- Foreign national or PCT filings based on a common priority
- National stage applications from international (PCT) filings
Here’s what you can achieve using the Family Tree in the TIP Tool™:
- Know which filing acts as the “starting point” for all related applications — critical for determining what prior art applies.
- Instantly spot global coverage and identify regions where you may want to expand with foreign filings.
- Visualize which claims have already been pursued and which ones still have room for protection through new filings.
- If there’s no filing linked to a major market or a technical improvement, the Family Tree highlights that gap.
- With one glance, assess what’s issued, pending, or expired in the family and how the family supports business objectives or enforcement strategy.
Where to Access the Family Tree Generator
You can access the Triangle IP Family Tree Generator through multiple ways:
1. From the TIP Tool™ Portfolio Manager (Logged-In Users)
- Navigate to the Portfolio Manager

- Select a Filed Application
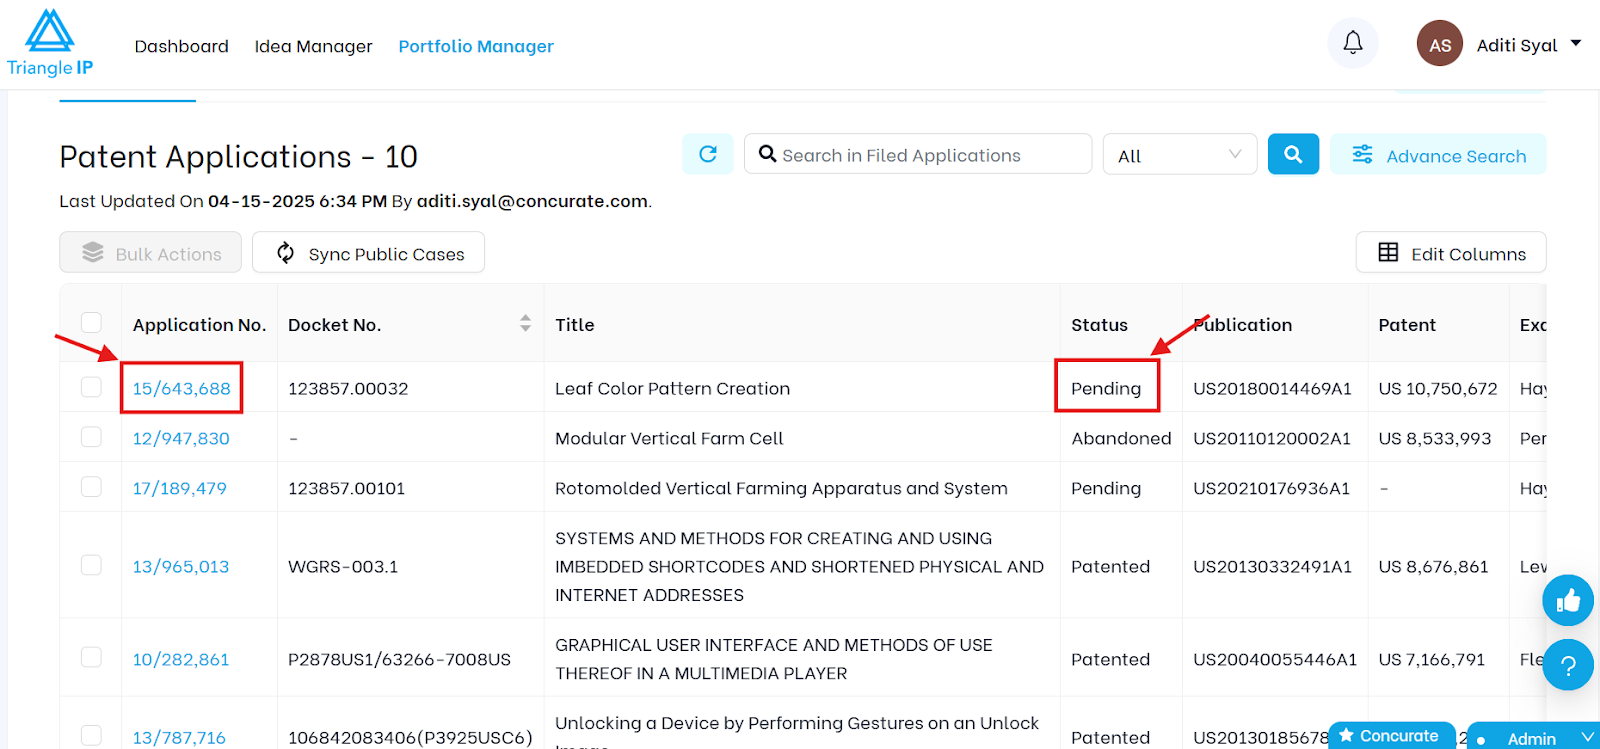
- Click the Family Tree tab (Available in Gantt, Classic, or Modern views)
2. Via the Family Tree on the Top Navigation Bar
- Login to TIP ToolTM

- Navigate to the Family Tree tab in the top navigation bar.
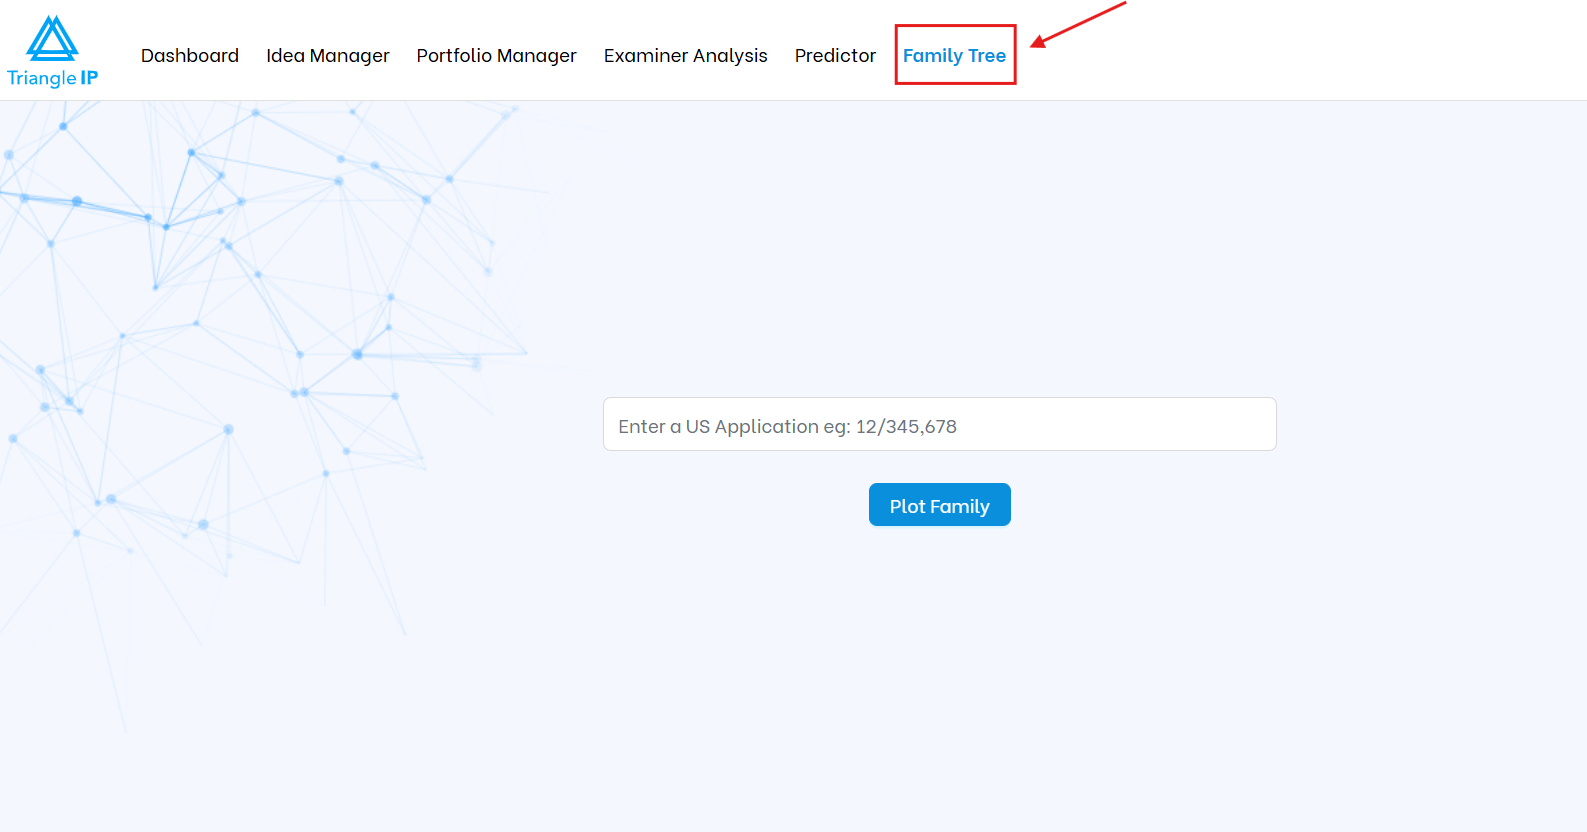
- Input any public US patent application number in the asked format.
- Automatically generates and displays a visual map of related patent applications (family members) using publicly available records such as data from the USPTO’s Public PAIR, INPADOC, or Espacenet.
Understanding the Three Visualization Modes in the TIP Tool™ Family Tree
Here’s a breakdown of what each view offers and when to use it:
1. Gantt Chart View – Found in the Portfolio Manager
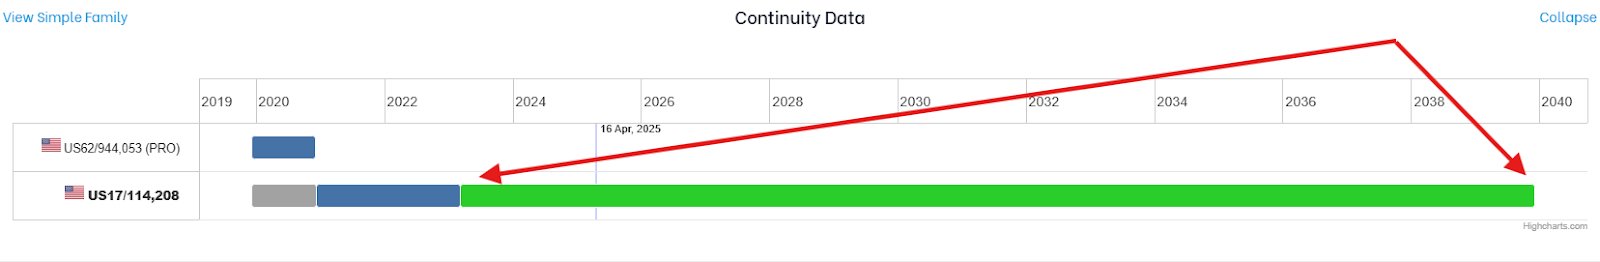
The Gantt Chart View, located inside the Continuity Data section of the Portfolio Manager, visually displays the full lifecycle of each family member from filing to expiration.
It’s a powerful timeline-based view that helps you track term, pendency, and overlapping filings across your patent family.
How to Read the Gantt Chart
The Gantt chart provides a visual timeline of each patent application’s lifecycle. Each row corresponds to a specific application, and the horizontal bars represent different stages in that application’s journey. Here’s how to interpret the chart elements:
- Gray Bar
Represents a Provisional Application, labeled as PRO. This reflects the earliest filing date but does not count toward an enforceable patent term.
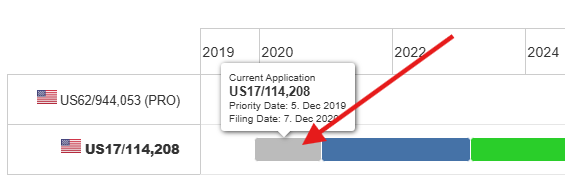
- Blue Bar
Shows the pendency period — the time from the filing of a non-provisional application until the patent is granted.
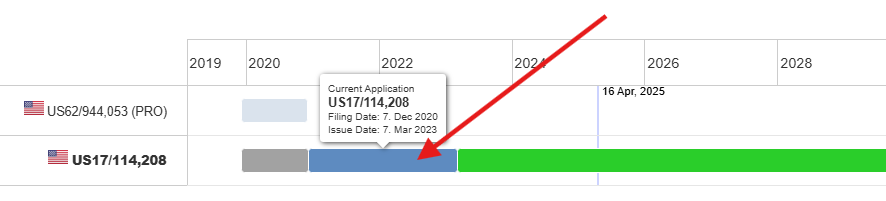
- Green Bar
Indicates the enforceable patent term — the period from issuance to expiration of the patent.
- Application Labels (PRO, CON, CIP, etc.)
These appear alongside the bars to identify the application type:- PRO = Provisional
- CON = Continuation
- CIP = Continuation-in-Part
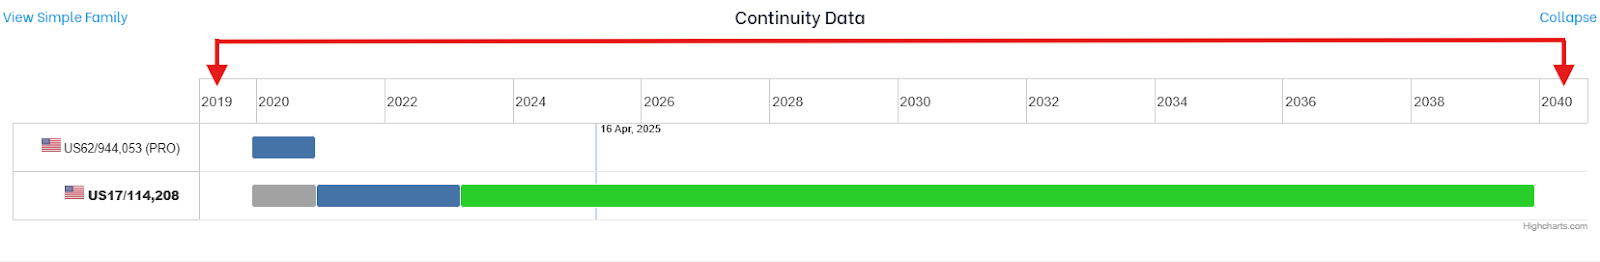
- Timeline at the Top
A chronological scale that spans across years, helping you visualize key lifecycle dates such as filing, grant, and expiry.
- Tooltip on Hover
Hovering over any bar displays detailed metadata, including application number, filing date, issue date, and expiration date.
- Position and Length of the Bar
Indicates when the application was filed and how long it remained in each stage—helping you understand pendency duration and enforceable life at a glance.
2. Modern View
The Modern View provides a timeline-based visualization that maps out the chronological order of filings across jurisdictions, while visually representing relationships between patent family members such as provisional, continuation, and international filings.
This view is ideal for seeing how and when filings were made, and how each application connects to its predecessor or sibling within the family.
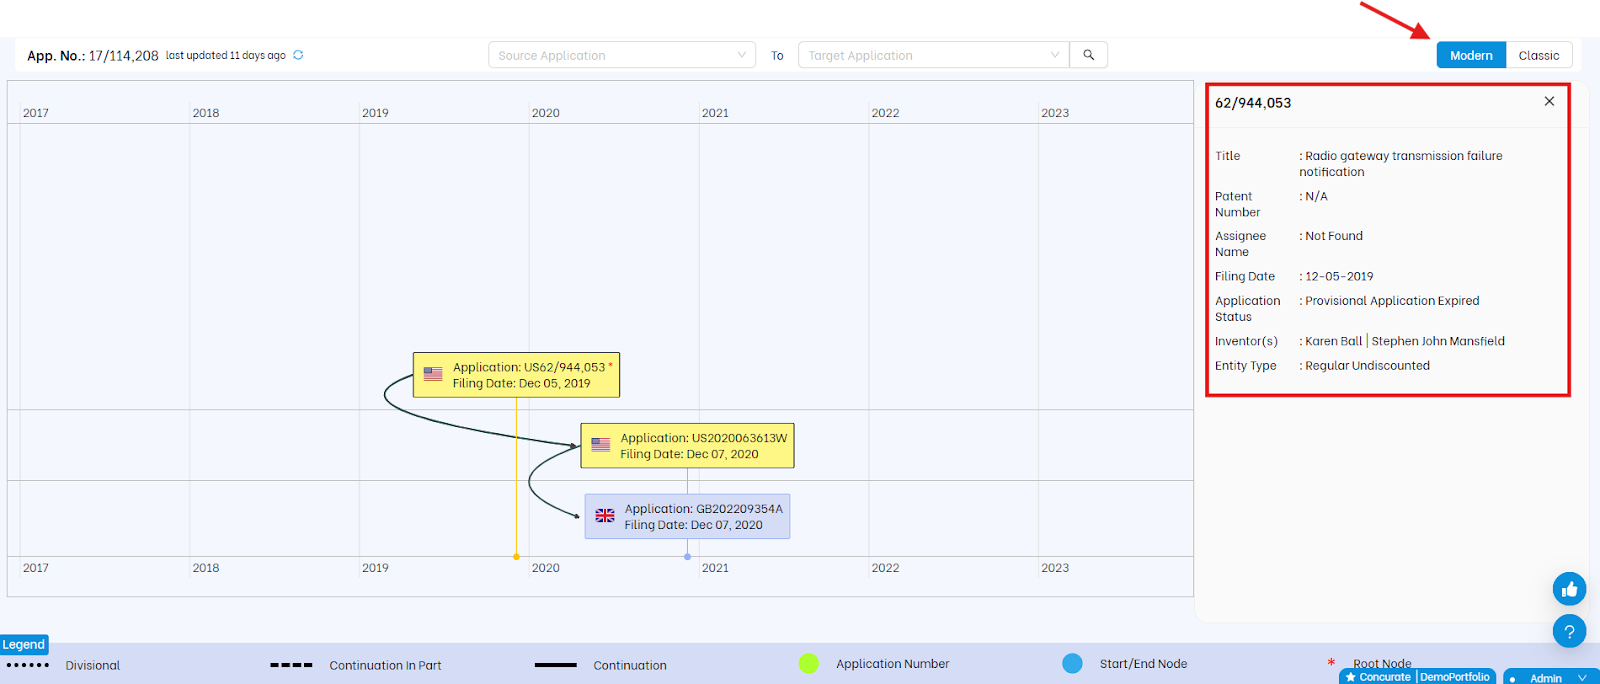
How to Read the Modern View
The Application Family Tree view provides a visual map of how patent filings relate to each other across jurisdictions and generations. Here’s how to interpret each element in the chart:
- Timeline Across the Top
A horizontal chronological scale that helps you place each filing by its year.
- Rectangular Application Blocks
Each block represents an individual patent application. It displays the application number, filing date and a country flag to indicate the jurisdiction.
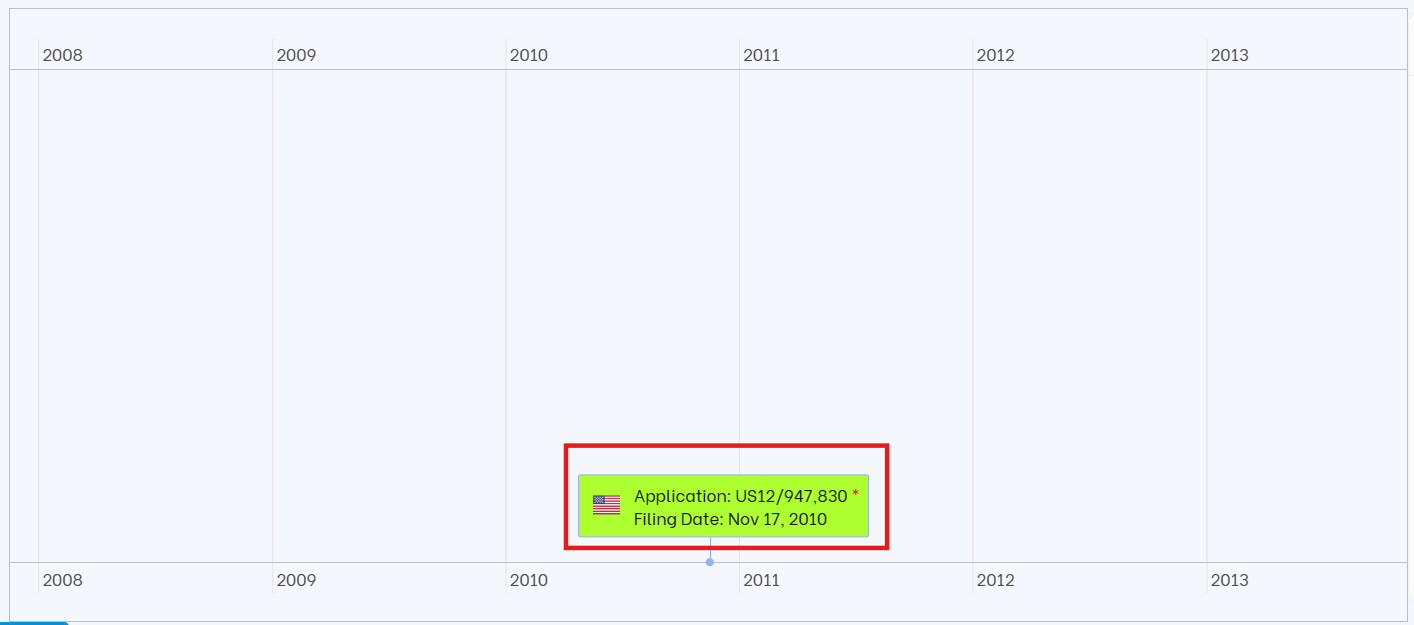
- Yellow Block
Indicates a U.S. non-provisional application. This color is used consistently for high visibility.
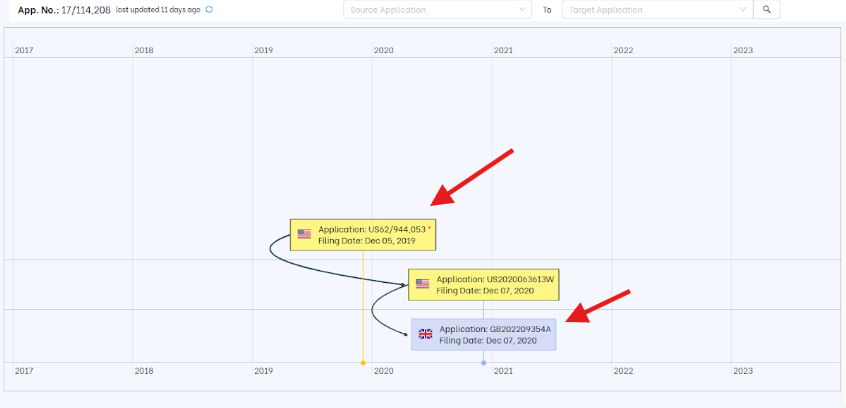
- Blue Block
Represents a foreign (non-U.S.) application, making it easy to distinguish international filings. - Curved Arrows
Show the relationship between applications, such as parent-child connections within a family tree.
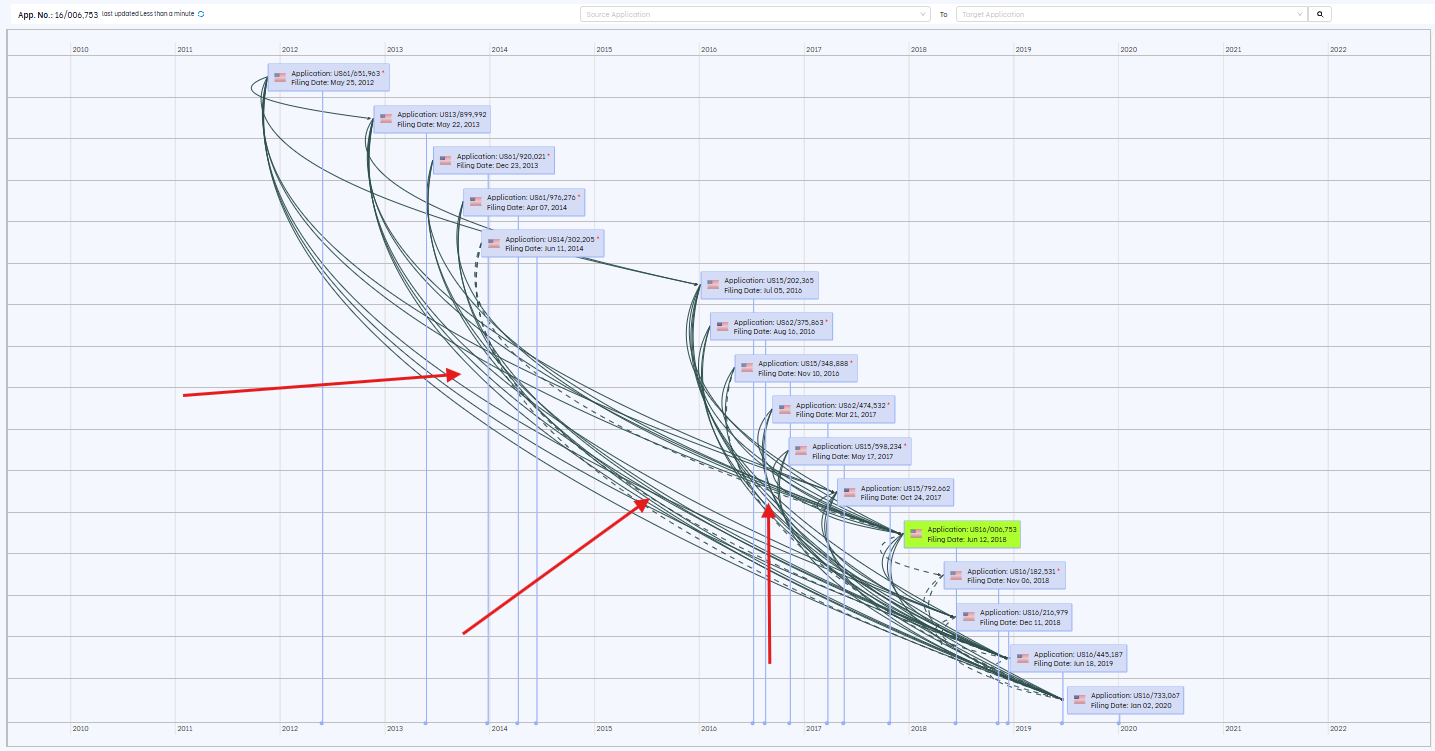
- Line Styles (See Legend Below the Chart)
Different line styles represent the type of continuation relationship:
- Solid Line = Continuation
- Dotted Line = Divisional
- Dashed Line = Continuation-in-Part (CIP)
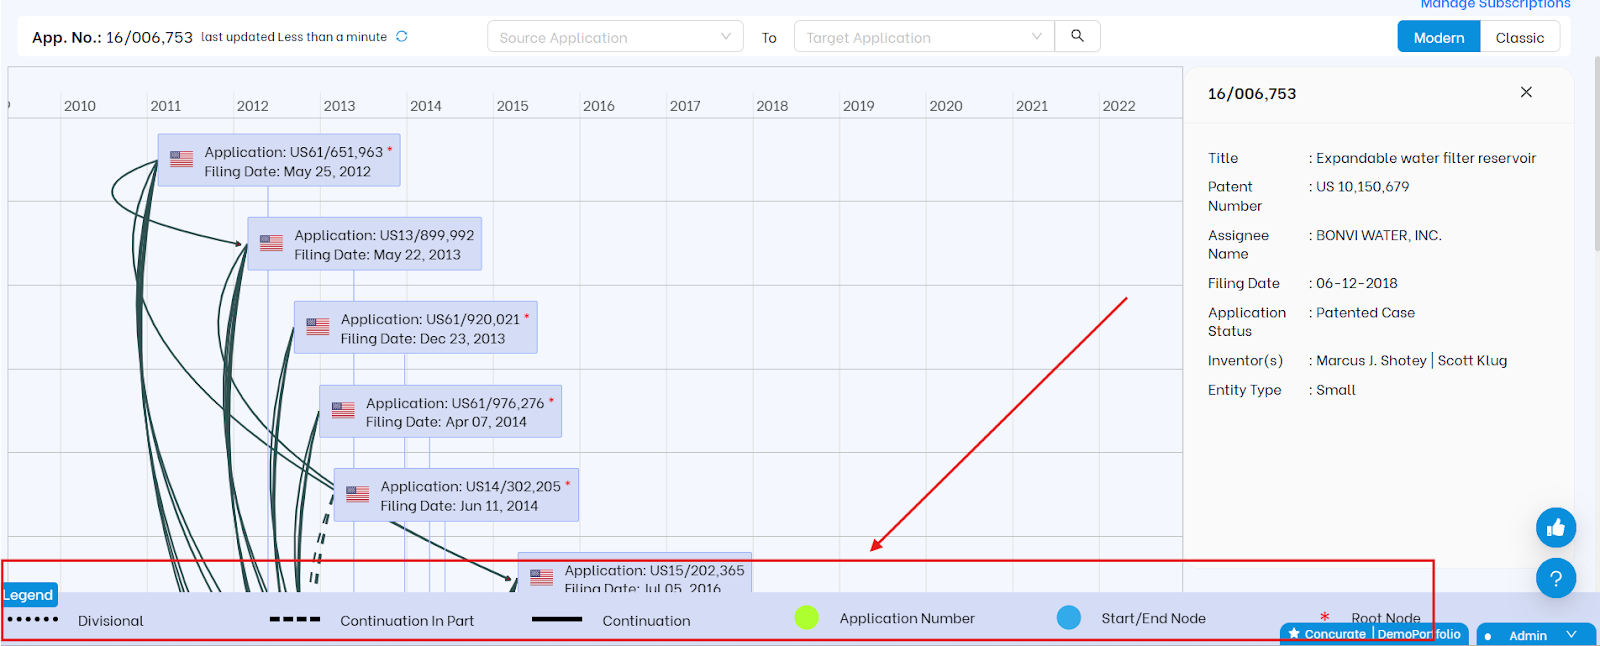
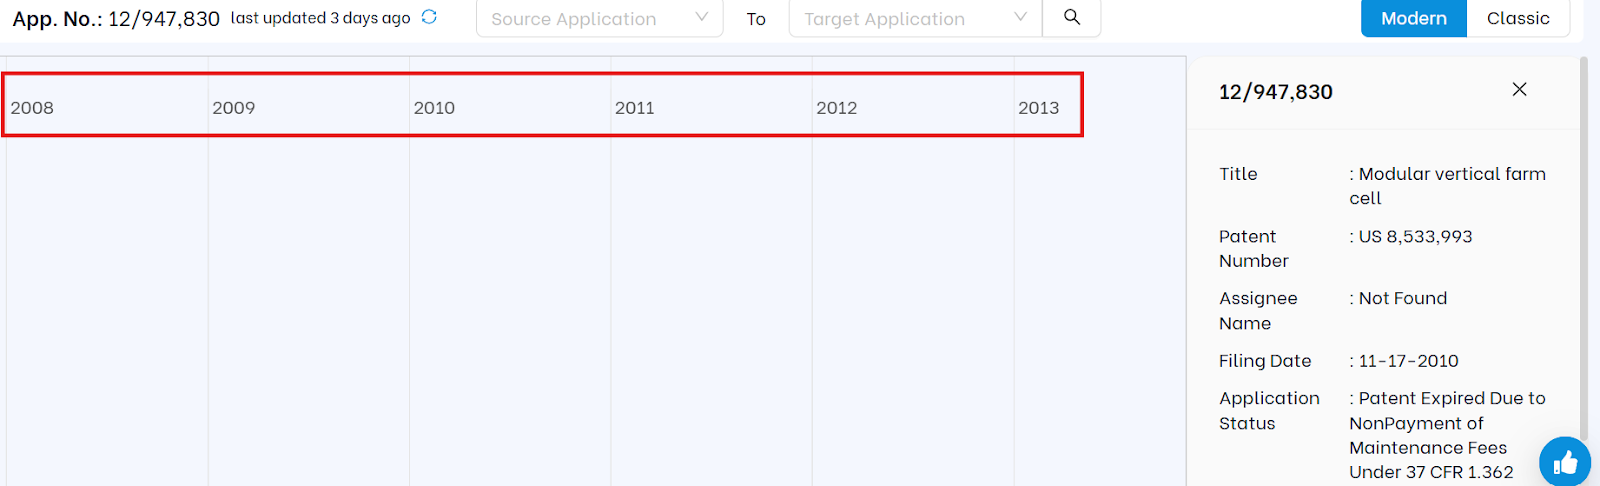
- Tooltip on Hover
Hovering over any application block reveals additional metadata, including:- Application title
- Patent number
- Assignee name
- Filing date
- Application status
- Inventor (s)
- Entity type
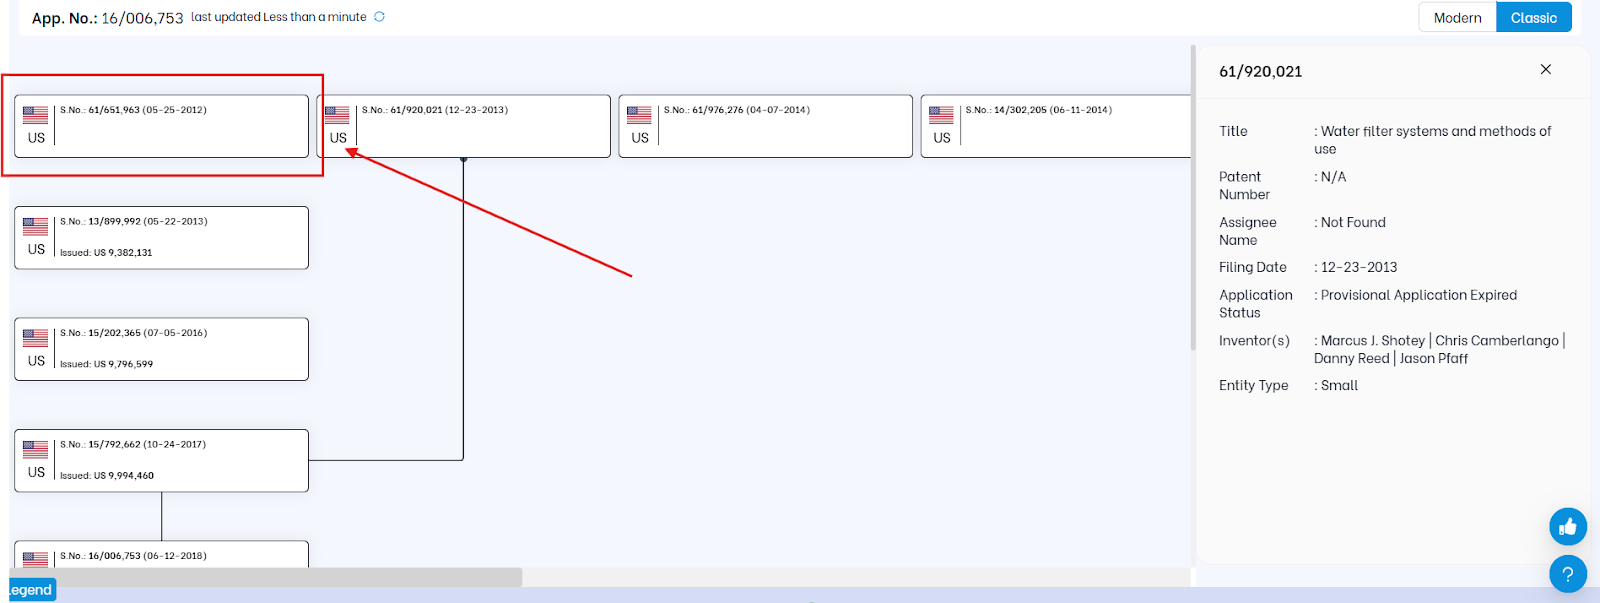
3. Classic View (Genealogical Format)
The Classic View in the TIP Tool™ provides a genealogy-style visualization of your patent portfolio, built specifically to help you analyze direct and indirect priority relationships across family members. Unlike the timeline-based Modern View, this layout focuses purely on how applications are structurally connected, offering unmatched clarity into the legal lineage of filings across jurisdictions.
It’s ideal for legal teams, patent strategists, and R&D managers who need to map continuity chains and plan continuation strategies with precision.
How to Read the Classic View
This view emphasizes relationship clarity and application status using directional arrows, line styles, and color cues to help you decode family structure at a glance.
Here’s how to interpret each visual element:
- Rectangular Boxes
Each box represents a unique patent application. Key details shown include:
- Serial number
- Filing date
- Publication number
- Issue date (if granted)
- Arrows Between Boxes
Arrows point from parent to child application, clearly showing the direction of priority claims. This helps you trace lineage and understand which applications stem from others.
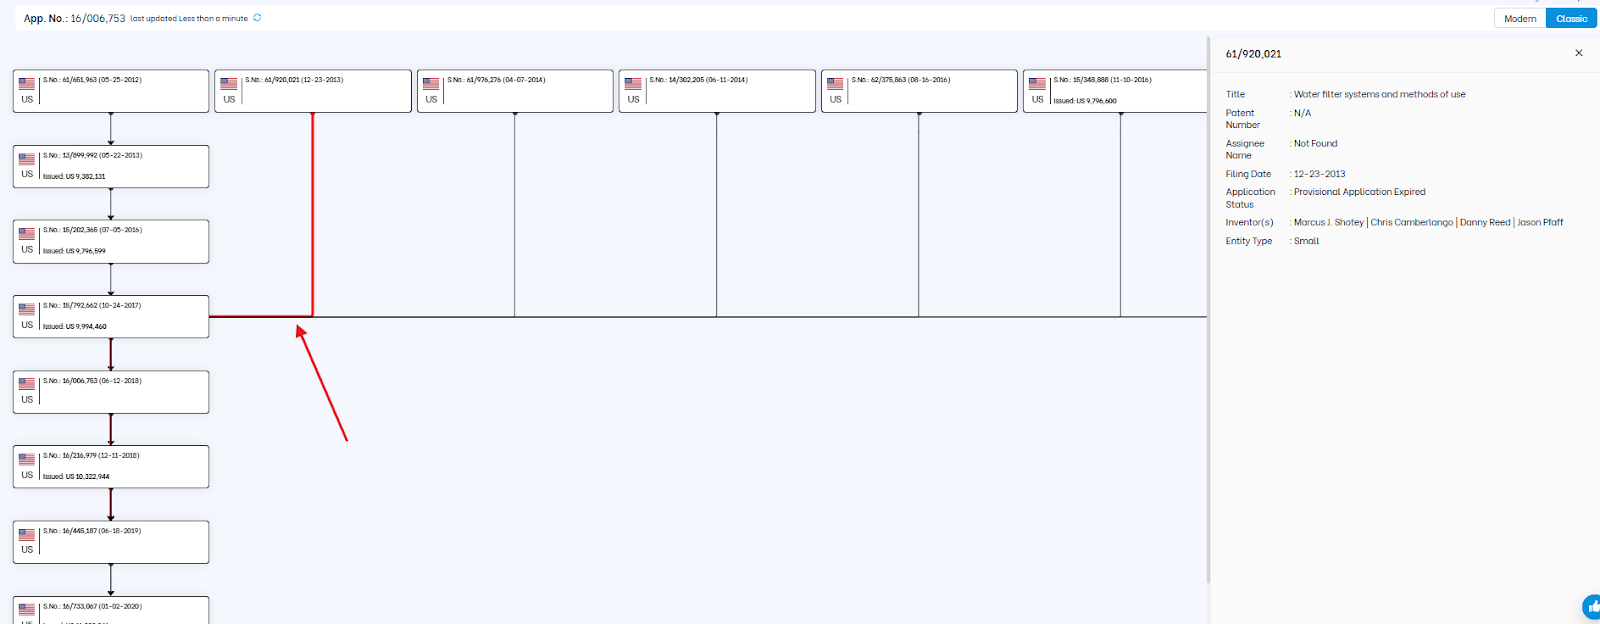
- Line Styles (as shown in the legend below the chart)
Different line styles identify the type of relationship:
- Small Dotted Line = Divisional
- Dashed Line = Continuation-in-Part (CIP)
- Solid Line = Continuation

- Color-Coded Relationship Lines (Visible on Hover)
Hovering over a line will highlight it and reveal its relationship type through color:
- Red = Continuation
- Blue = CIP
- Pink = Divisional
- Application Status (Based on Box Color)
The color of each application box reflects its current status:
- Green = Issued patent
- Yellow = Pending application
- Gray = Expired or Abandoned application
What’s Different in Classic View
- More metadata in boxes: Unlike the Modern View, which shows only application number and filing date, Classic View includes publication number and issue date.
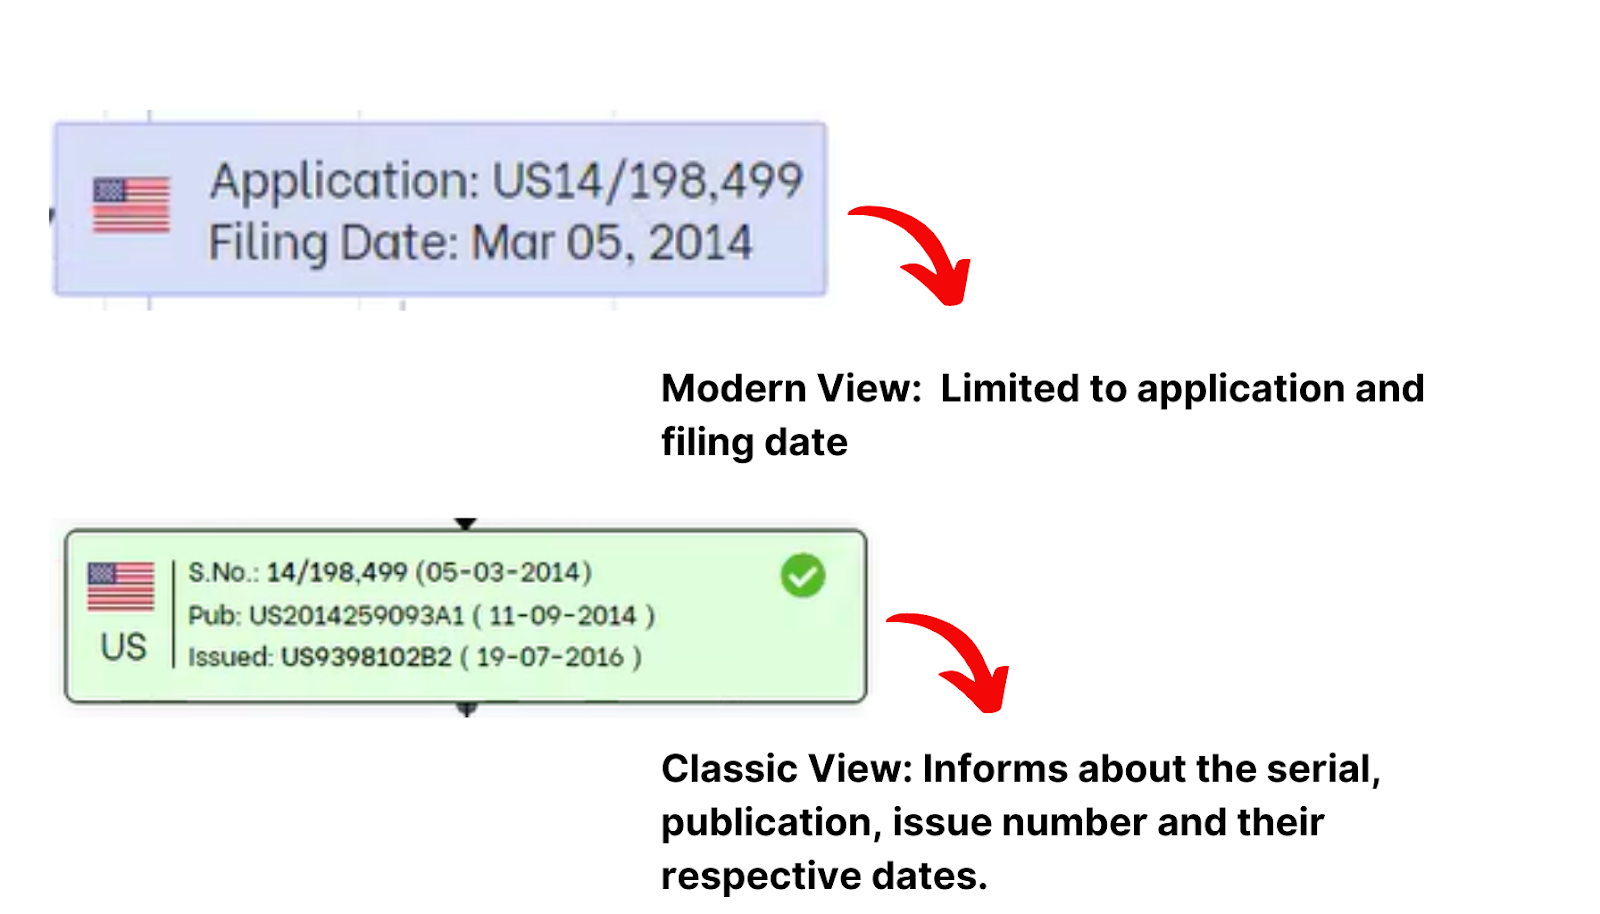
- Hover-based color feedback: Helps quickly identify the type of relationship between applications.
- Clearer priority mapping: Shows both direct and indirect connections often missed in linear views.